Co-designing tool to drive energy cost reduction
Aim
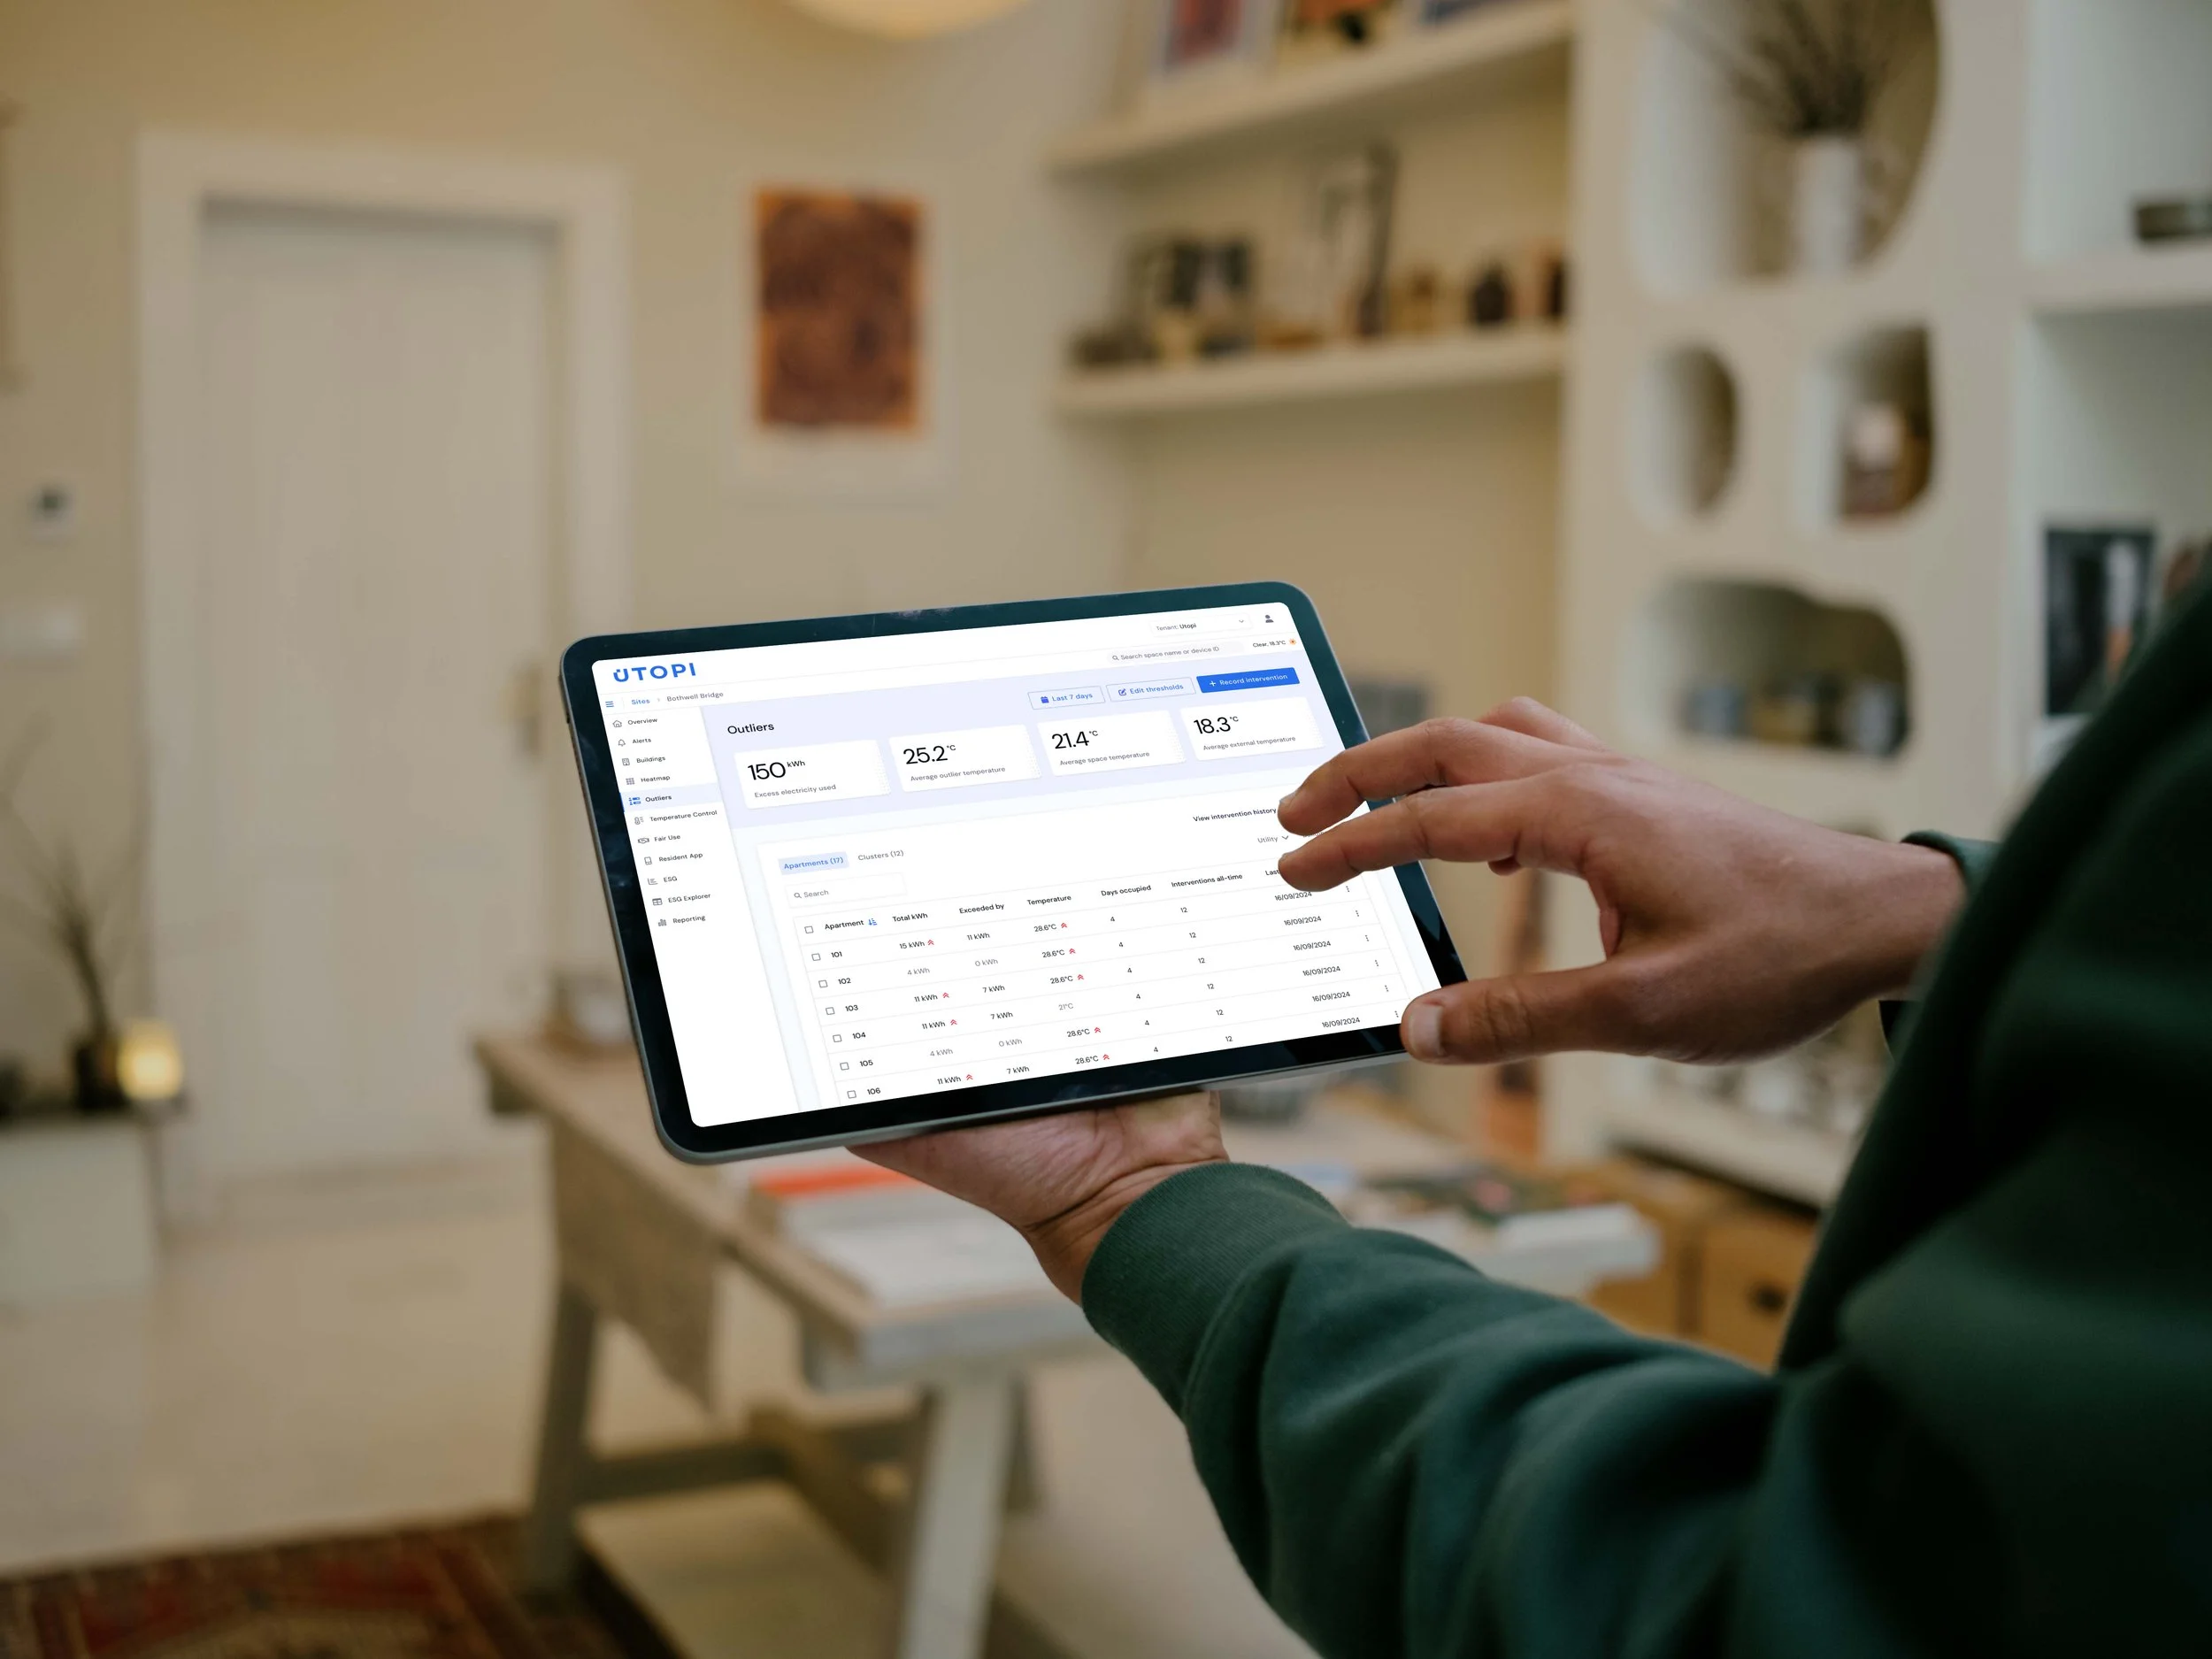
Teaming up with a senior designer, I helped create the ‘Outliers’ tool, giving site teams a way to monitor, track, and reduce energy consumption in overheated rooms within student accommodation.
This solution goes beyond cutting costs—it drives a sustainable, eco-conscious approach to Build-to-Rent (BTR) property management by tackling energy waste at its core.
Part of a broader initiative, it works with the ‘Resident App’ reward system, encouraging students to adopt energy-saving habits and earn rewards for achieving sustainability goals.
User Persona
Persona
Building Manager is a multifaceted role focused on resolving issues, coordinating maintenance, and engaging tenants to promote and educate about energy-saving behaviors.
Behaviour
Attends a bi-weekly meeting with the Utopi customer officer to review an Excel document listing overheated rooms. After noting the room numbers, they reach out to residents—either by door knocking or email—to investigate the issue. It’s a repetitive, manual, and time-consuming task.
Pain Point
Overworked asset managers are stretched thin, juggling 14+ platforms and coping with understaffed teams, leading to burnout and inefficiency.
User need:
An intuitive solution that simplifies interventions and tracks the impact of energy reduction efforts
1. Outlier feature
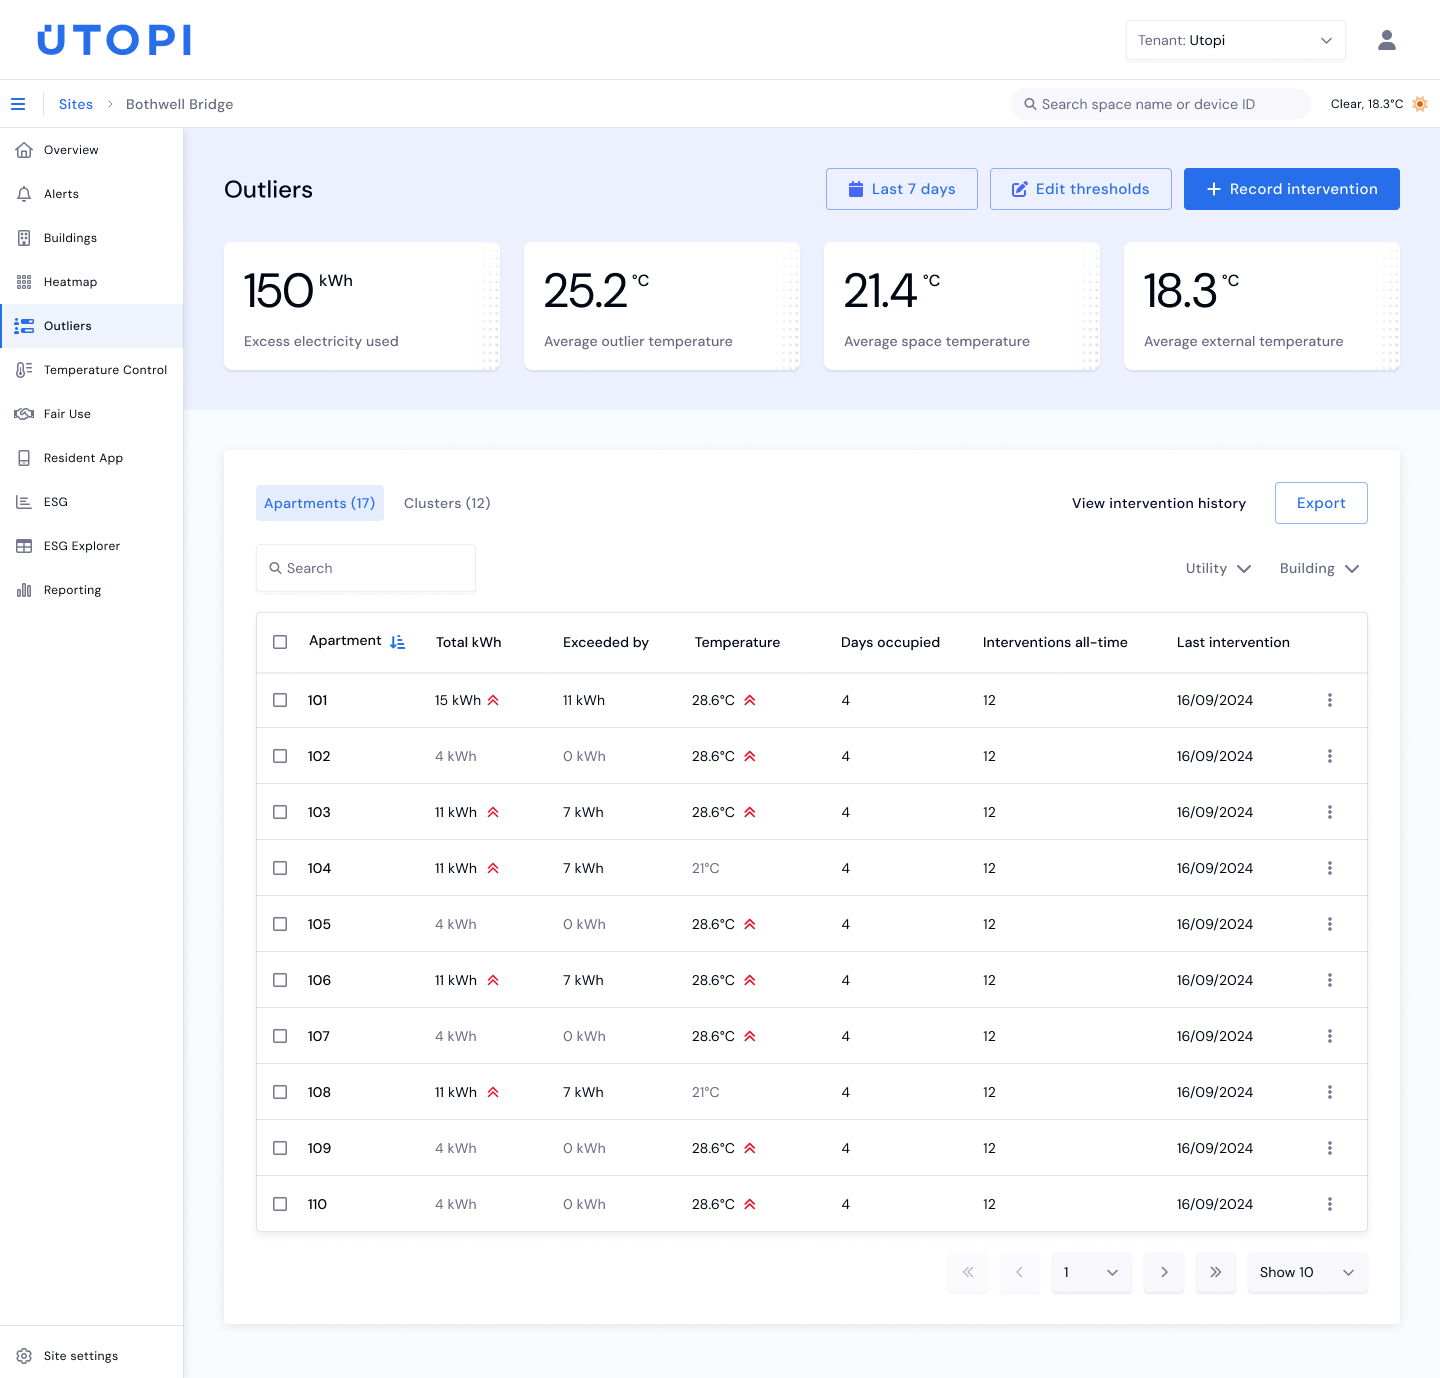
By identifying the top 10% of overheated rooms, this tool empowers site teams to tackle excessive energy consumption.
2. Setting thresholds
Defining the parameters for energy outliers. Recommended temperature and electricity values are provided to guide first-time users.
Decision
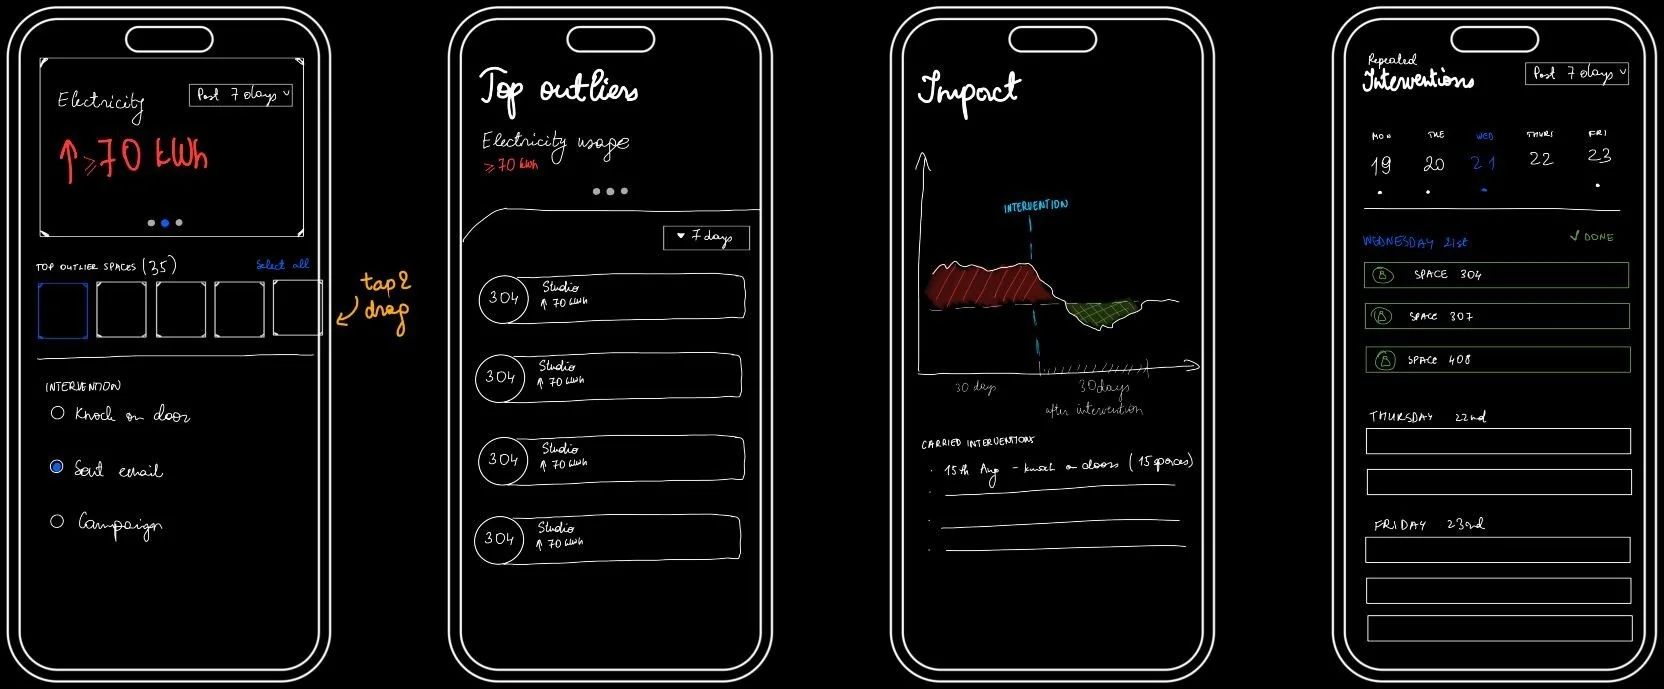
Mobile-first approach
After careful consideration, we decided to prioritize speed and exclude a mobile-first approach from the MVP to ensure a quick release.
However, we have kept this option in mind as a potential direction for future development, which could eventually lead to implementing a Responsive Web Design (RWD) approach down the line.
Desktop-first approach
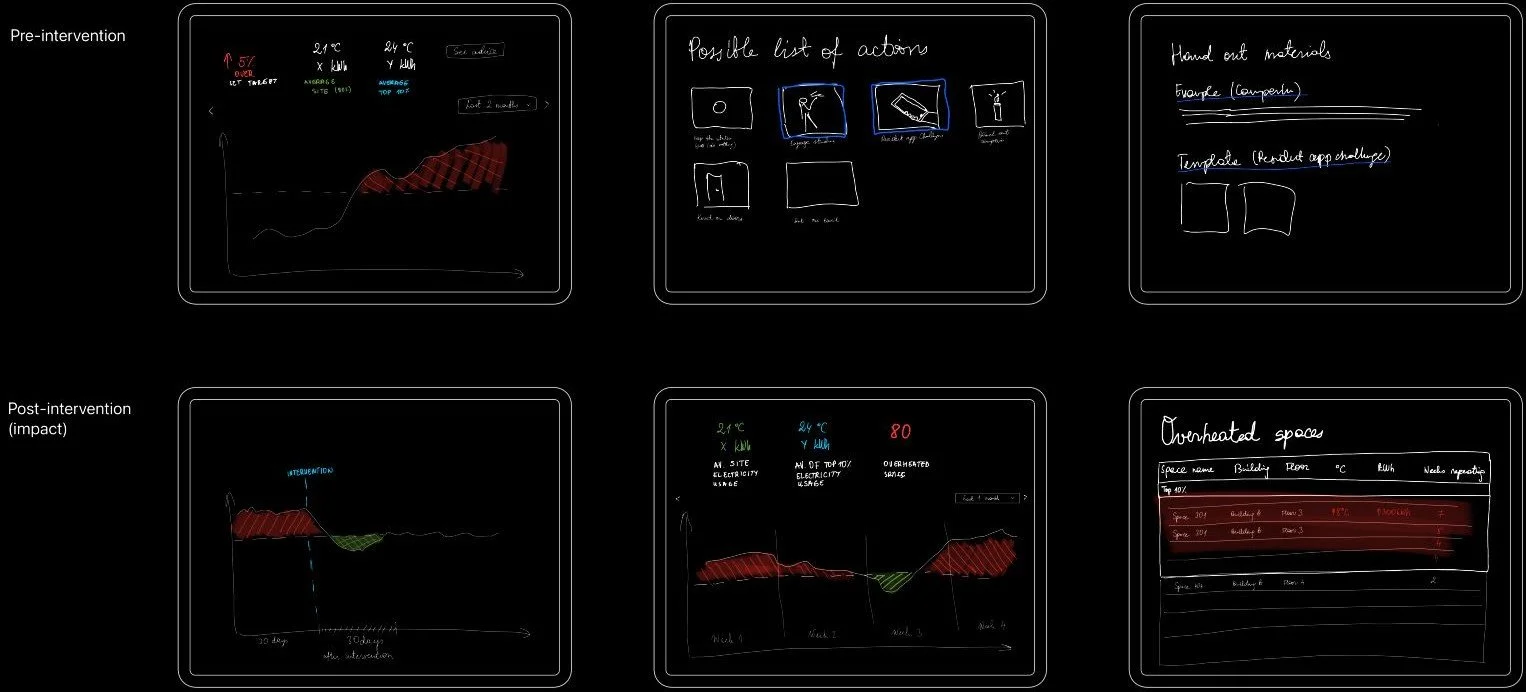
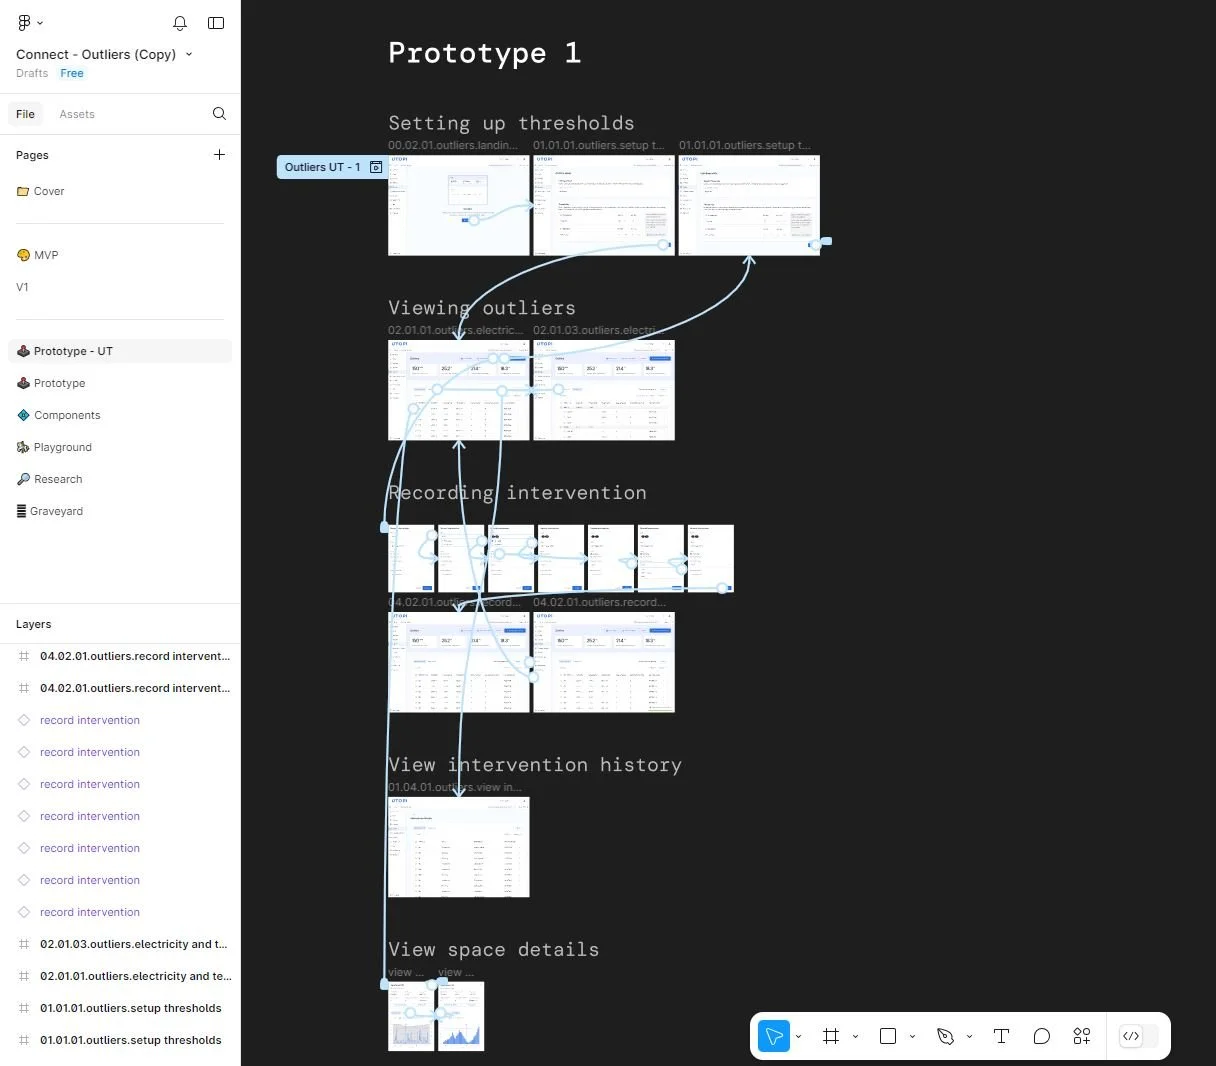
Wireframe prototyping
User testing
We conducted five user testing sessions with an interactive Figma prototype to observe how asset managers interact with the feature. Our goal was to ensure the information was clear, relatable, and helpful in their daily work, while also understanding their overall experience with the feature..
Key takeaway
Rather than pushing for a complete shift in behavior, we recalibrated our approach, focusing on designing the 'Record intervention' process to be as effortless as possible for the user. This shift in perspective helped us create a solution that users were more likely to adopt without feeling burdened.
Decision
3-step flow
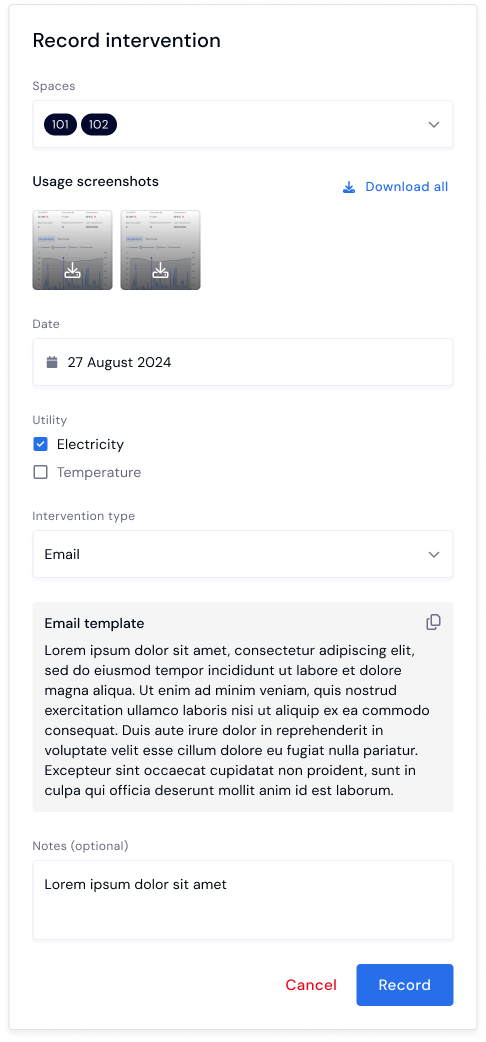
Simplified ‘Record intervention’ Flow
To enhance efficiency and reduce cognitive load, we have streamlined the 'Record intervention' process into a simple 3-step flow.
While the simplified design eliminates the opportunity to include resident communication, it effectively focuses on the main goal: optimizing intervention logging. By removing the need to select usage screenshots and adjust the resident contact email template, the process becomes faster and more straightforward.
Multi-step flow
What does it do?
Secondary mission:
🧍🏾 Support Energy-Conscious Education
👱🏽 Promote Energy-Saving Habits
❄️ Alert Low Temperature Rooms
🥵 Endorse Resident Well-Being
Primary mission:
📉 Reduce Energy Consumption
♨️ Identifiy Outliers
👀 Monitor Temperature and Electricity Usage
🌡️ Report to Upper Management
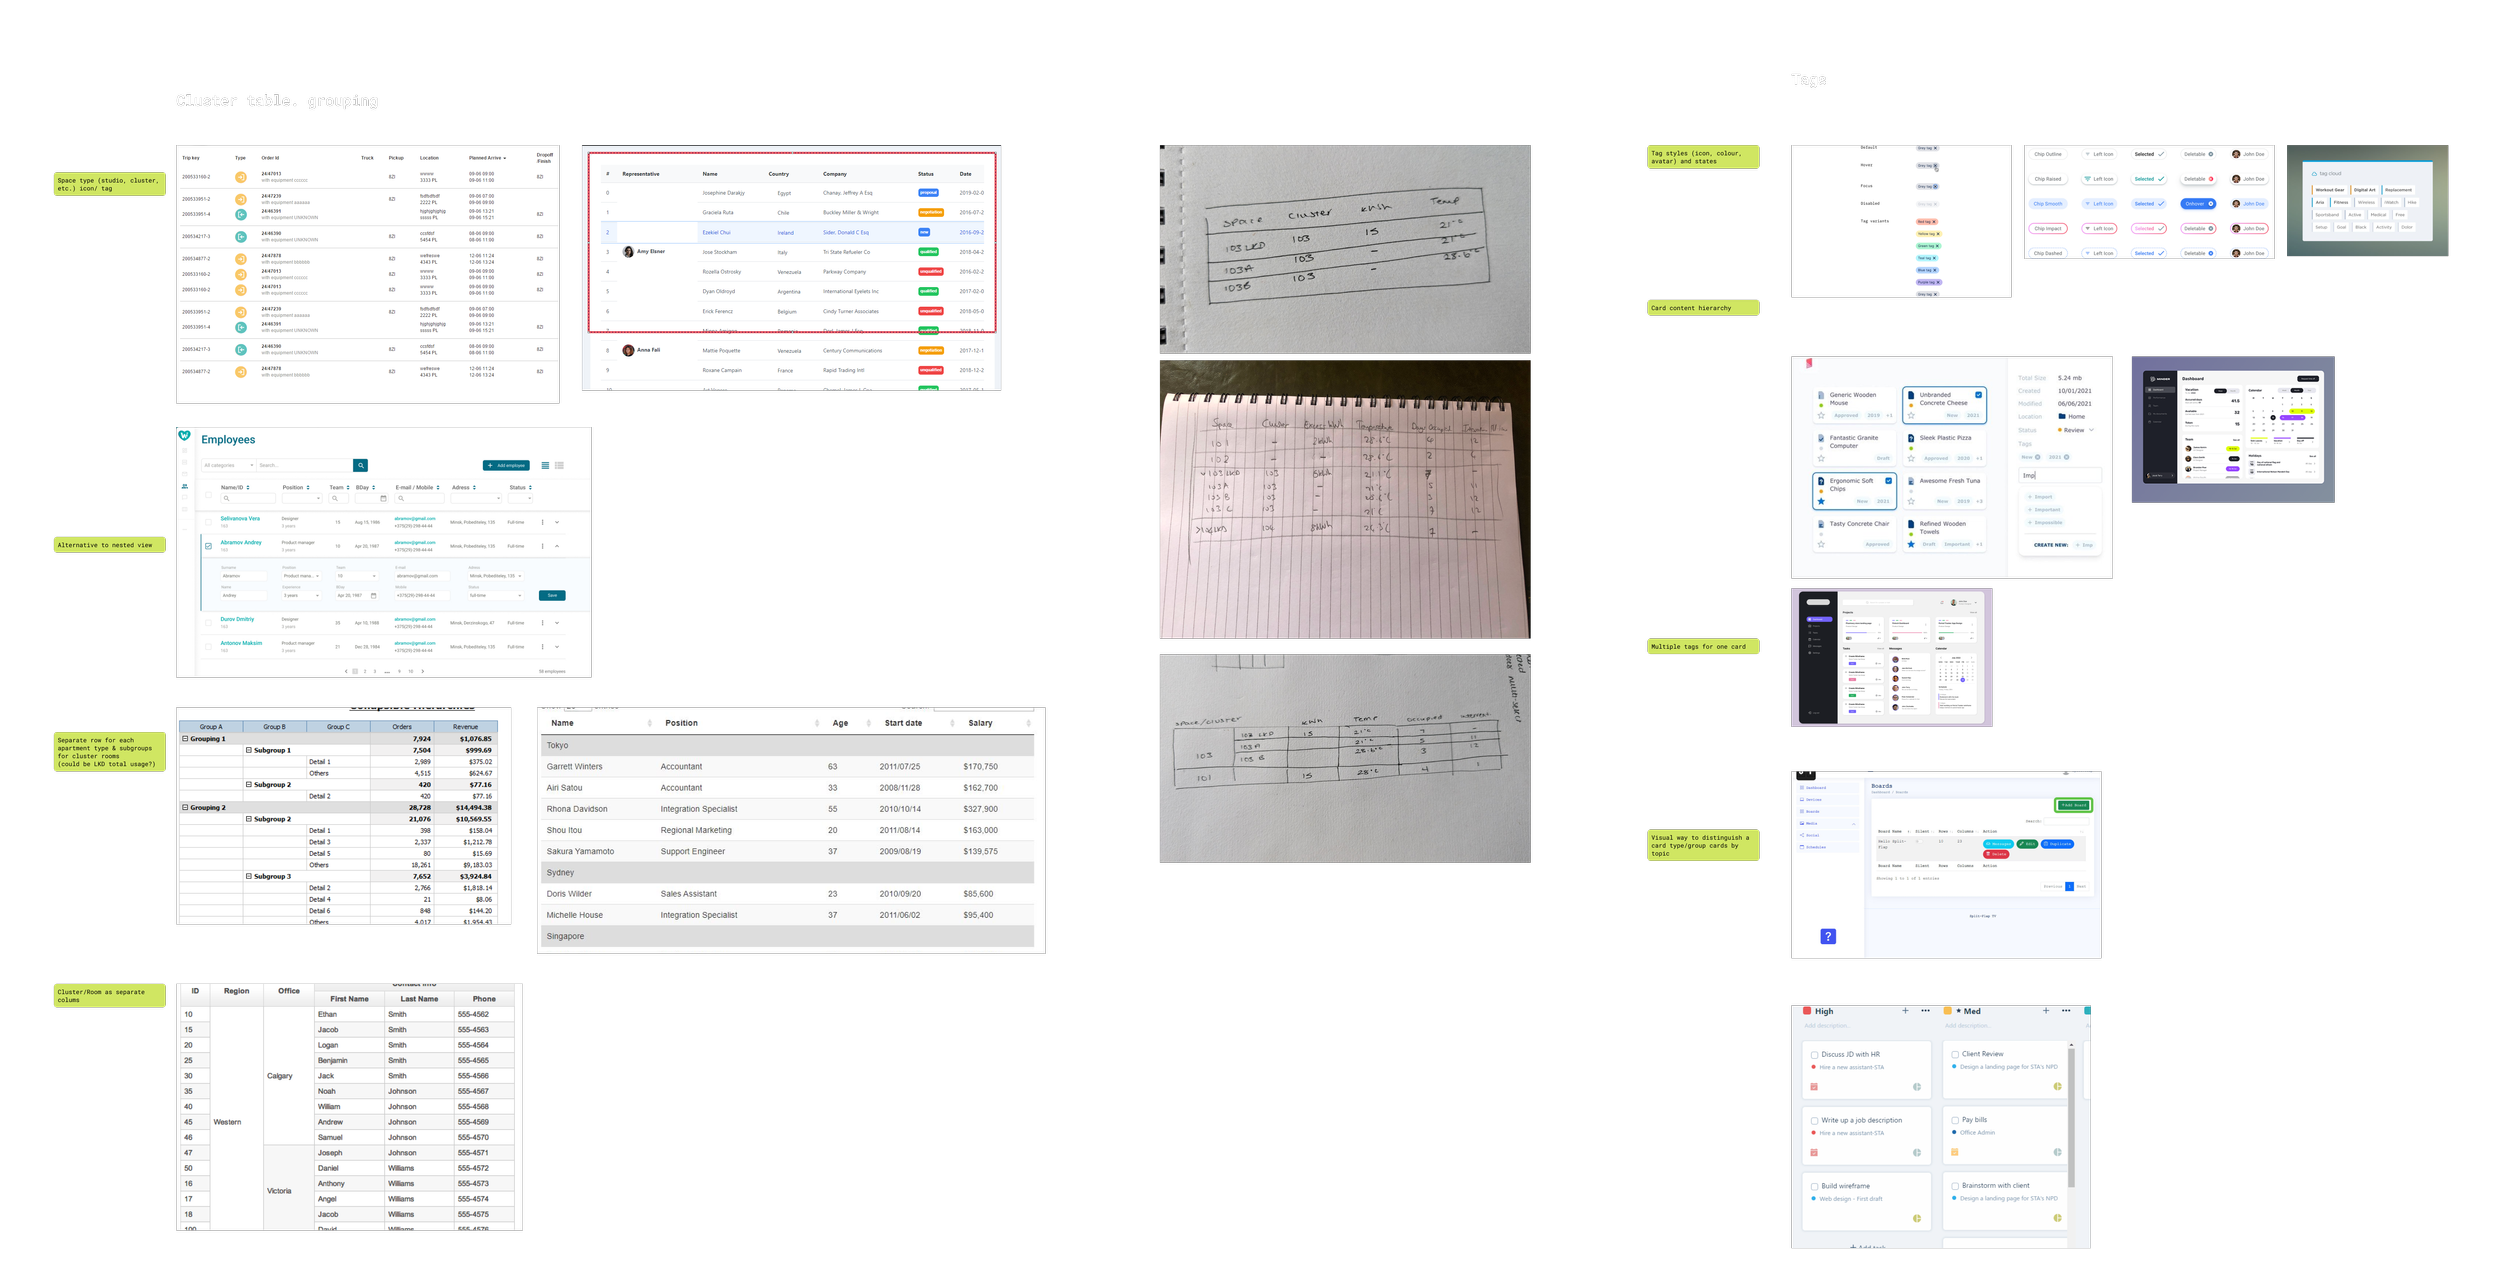
Research examples
3. 1. See electricity and temperature outliers- Apartments
Individual apartments, such as studios, have a solo resident. This allows Electricity usage (15kWh) and Temperature (28.6°C) to be assigned to a singular consumer.
The distinction is important for how the data is processed and displayed.
Challenge
Displaying electricity outliers at the cluster level presented a challenge because
a cluster consists of multiple bedrooms (therefore, multiple consumers).
However
the shared electricity meter measures the cumulative usage of the entire cluster
Formula: shared kitchen (203LKD) + number of bedrooms (203A + 203B + … ) = cluster usage.
This created a UI challenge in displaying both temperature and electricity cluster outliers in a single table.
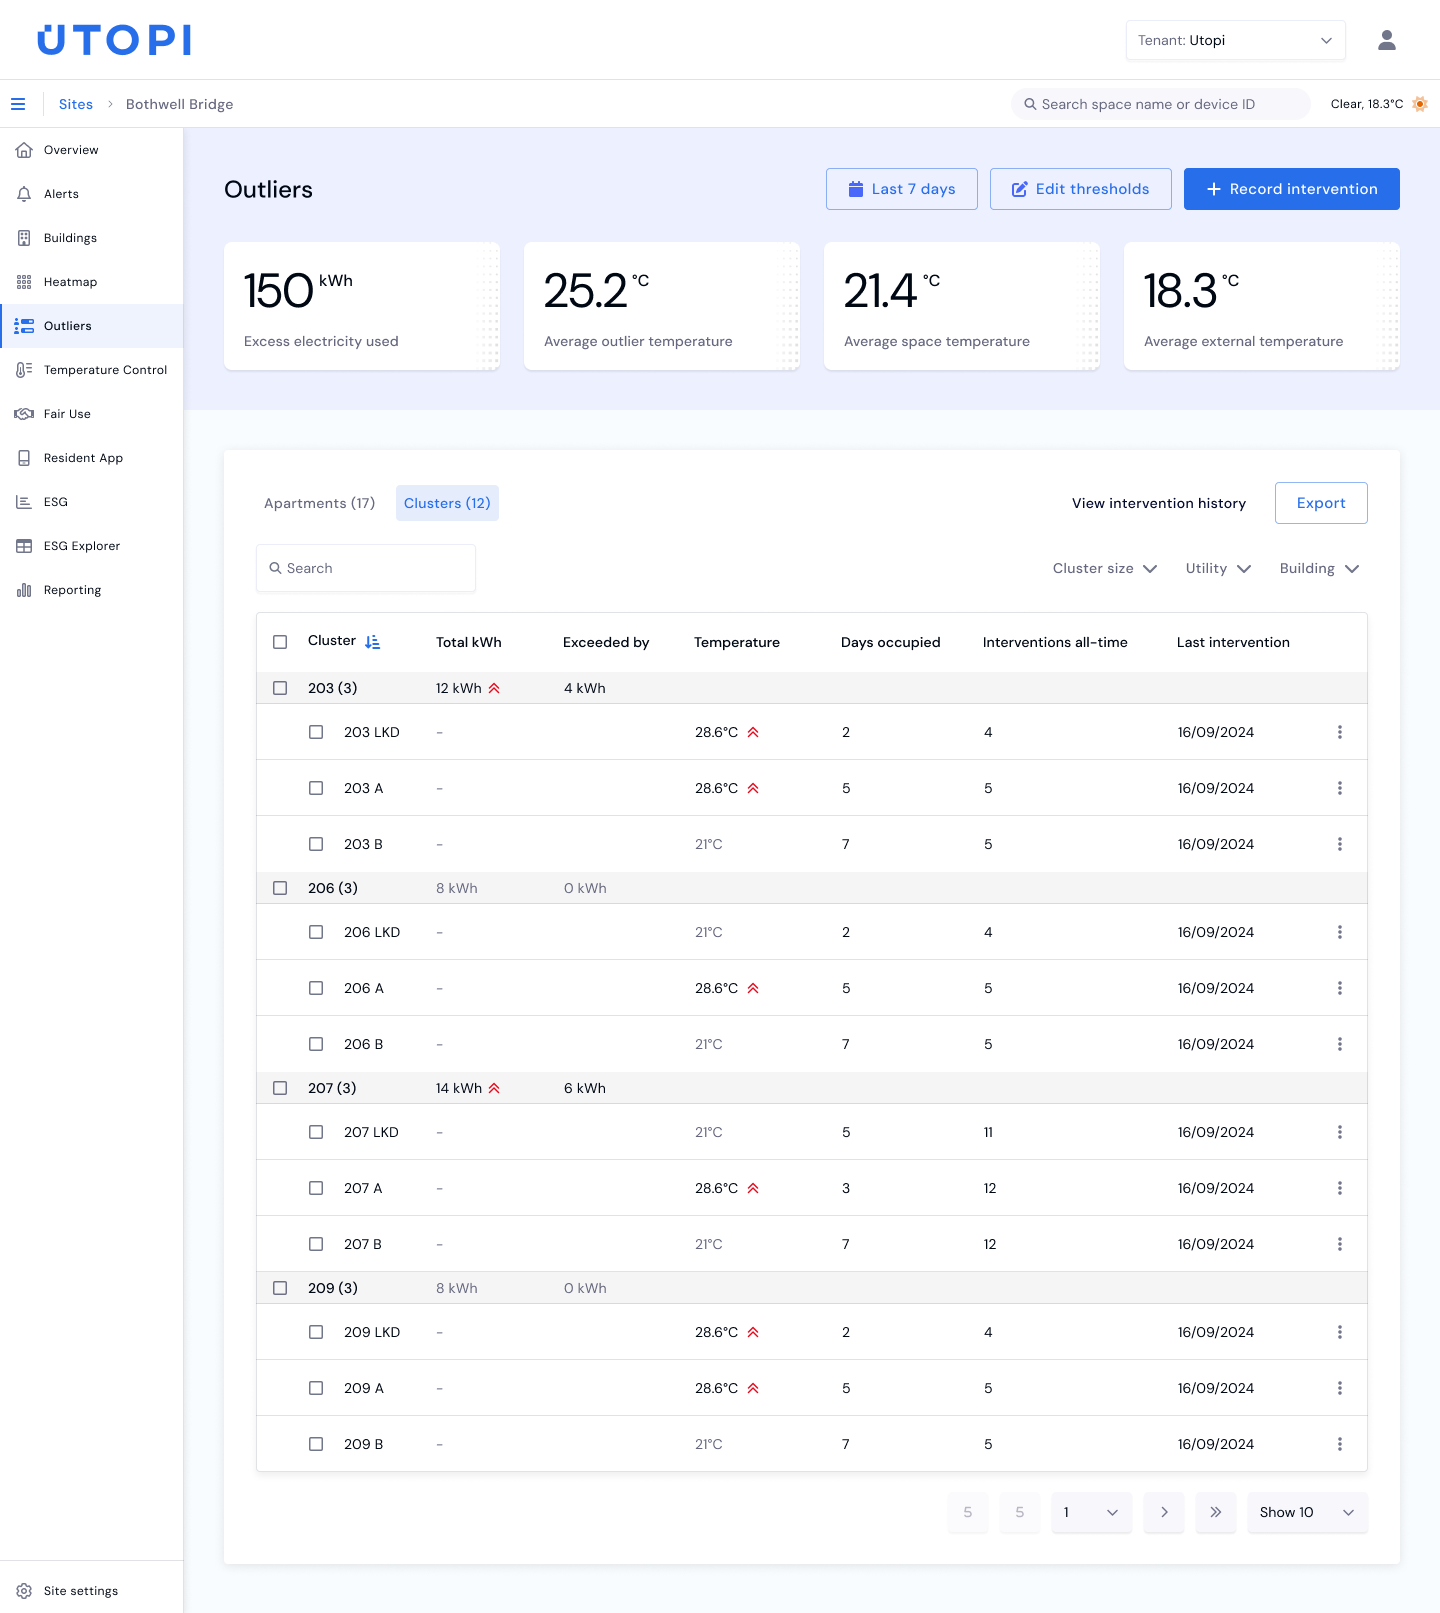
3.2. See electricity and temperature outliers- Clusters
Final design to show Electricity per cluster (12kWh) and Temperature per room (203LKD 28.6°C, 203A 28.6°C, 203B 21°C).
How would the user know which room is the real outlier?
Looking at the table above (3.2 See Electricity and Temperature Outliers – Clusters), we can see that cluster 203 is an outlier. However, since the cluster is shared between multiple tenants, how would the site teams know which resident needs an intervention?
Solution: By examining the Temperature section, we can see that bedroom 203A is overheated at 28.6°C, while 203B is at a comfortable 21°C. Based on this, we can reasonably assume that 203A is most likely the outlier needing an intervention.
What would I suggest doing differently next time?
-
Recruiting the right participants is essential. Due to certain limitations, only 1 out of 5 participants truly matched the target audience—an asset manager. This had a significant impact on the feedback we received. The participant who fit the profile found the feature highly relevant and useful, while the others, who weren’t as closely aligned with the role, provided more general feedback based on assumptions or their best guesses.
Note for the future: To gather more focused and actionable insights, it’s crucial to ensure that all participants match the target audience description.
-
The key flow and user value clearly indicated that 'Recording Intervention' is a task users are likely to perform on the go, making a mobile or tablet-first approach more suitable. However, a desktop-first approach was chosen. Although the project is still in development, this decision highlights the need to consider how project priorities can be influenced by other initiatives within the broader product ecosystem.
Note for the future: To build the most effective solutions, take a holistic approach to how each feature fits into the broader product and service. Ensuring alignment with the desired user experience is crucial for creating seamless, user-centric solutions.
